
Since the introduction of Microsoft Fabric and Copilot in Power BI in May 2023, Microsoft has been hard at work developing and releasing new features as part of the planned development roadmap. There are few times in the history of Power BI that have had as much anticipation of new features as 2023-2024.
Today I’m discussing three new features for Power BI set to hit public preview in 2023, two of which just landed yesterday (Oct. 16). To see the full release schedule, check out this link from Microsoft.
Why should I care?
I discuss each in more detail below, but in general, these releases represent a move by Microsoft to consolidate report development into the Power BI Desktop interface exclusively, rather than relying on third-party external tools such as Tabular Editor and DAX Studio (though they are likely still used under the hood).
I believe this is to prepare Power BI for an authoring experience that is eventually moved 100% to the cloud and perhaps optimized for interaction with AI Copilots. In the short term, it improves the user experience for report developers by allowing them to perform all of their work in just one tool. For someone frequently working in Power BI Desktop, this is a helpful move.
Author calculation groups
The first exciting announcement is the ability to author calculation groups directly within Power BI Desktop! Previously, developers needed to download Tabular Editor 2 and author calculation groups using the External Tools feature of Power BI. This feature allows users to create calculation groups directly within the Power BI Desktop tool without needing to navigate to an external (and for some developers, unfamiliar) tool.
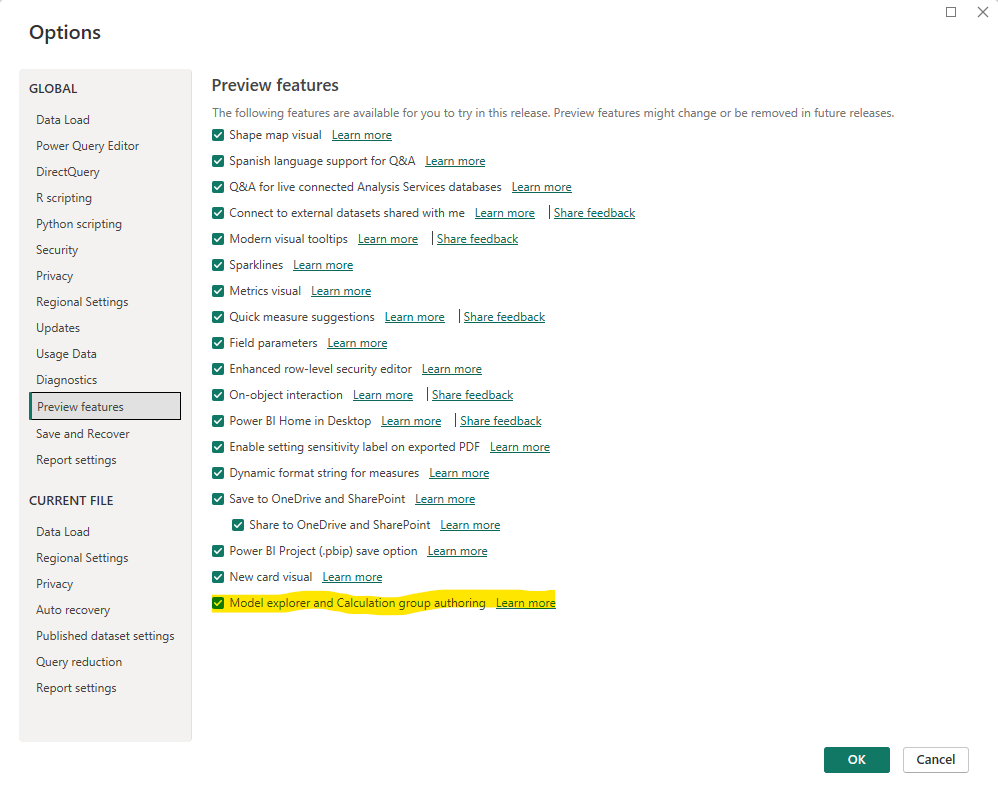
Make sure to turn this preview feature on under Options in Power BI Desktop.
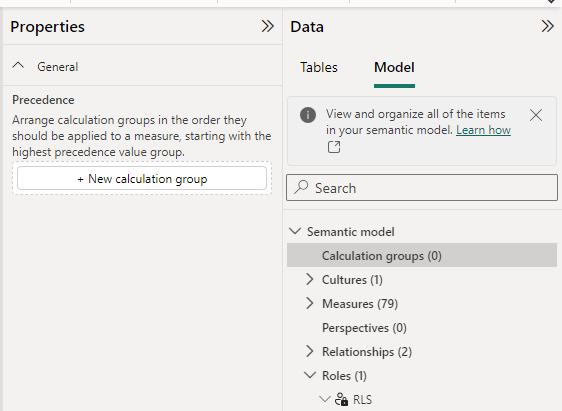
To author a calculation group, navigate to the Model View. Under the Data tab on the right side of the page, select “Model”. You’ll see the option create calculation groups, as well as other details of your semantic layer such as RLS roles, measures, tables and more (see the next section for more details).
Calculation groups can be an essential part of a clean data model and significantly reduce the number of measures that need to be written to compute repetitive logic, such as time intelligence. They are also incredibly helpful to use with slicers, SWITCH measures, and as page filters (for a variety of different scenarios). For a more detailed look, check out the series on calculation groups by Marco and Alberto from SQLBI; it’s the most comprehensive content available.
For beginning developers, learning a new tool such as Tabular Editor represented an unnecessary barrier to entry. This release reduces the complexity of using two tools and keeps the development work all within Power BI Desktop. I still highly recommend learning Tabular Editor for increased development efficiency, especially if your job requires you to consistently build tabular models. But for most users, this feature helps expand the tools in their tool belt, while keeping them in familiar territory.
Model explorer
The second release, mentioned earlier, is the model explorer, which allows you to view all components of a Power BI data model from the same pane.

The roles and relationships sections are of particular interest to me. Relationships allows you to modify existing relationships between tables and make them active or inactive. You can’t directly add new relationships in this pane, but the option is there to open the relationship editor to add new ones. This section can be easier to work with than opening individual relationships in the editor.
The roles section allows you view all RLS (row-level-security) roles that have been created in the model, along which tables the rules apply to. At this point you can’t modify or view the specific rules.
Previously it was easy to forget about RLS roles that had been created, since they were buried in the modeling tab on the Report view. I’ve had a number of occasions where I copied a previous Power BI Desktop file and removed the content, created my new report and published, forgetting that there was holdover RLS in place – until users complained about not having access.
Run DAX queries in Power BI Desktop
The third, and most exciting, release of 2023 is the ability to create and run DAX queries with Query view in Power BI Desktop. This is scheduled for November 2023. Along with this release will be the option to use DEFINE to view measure definitions in the query view, run queries using those measures, and even update them directly or add them to the model from this view.
For DAX developers familiar with DAX Studio, this is essentially bringing the key functionalities of the tool directly into the user experience of Power BI Desktop. Users will be able to run queries using EVALUATE against their Power BI data model, similar to how one might run a query using a SQL SELECT statement in a data warehouse.
The benefit of these features is two-fold. One, this represents further consolidation from an external tool, in this case DAX Studio, directly into Power BI Desktop, allowing developers to perform almost all of their work directly in one interface. Second, the Query view enables ad-hoc querying capabilities that allows for quicker insights into the data, improved ability to troubleshoot measures and report performance, and more robust features for DAX developers.
I will be closely monitoring this release and am interested to see how the eventual release of Power BI Copilots will utilize this feature. Perhaps AI will leverage these query capabilities to show users how their auto-generated reports have been constructed?
I encourage you to check out these new preview features. It’s an exciting time in the world of Power BI!

Leave a reply to Jake Burns Cancel reply