In the past few months, you might have noticed a new option appear in Power BI Desktop: the DAX Query View.

This article explains the background of this new tool and how it can help you when developing Power BI reports.
What is the DAX Query View?
The DAX Query View is a new feature that was added to Power BI Desktop in November 2023. Its basic function is to allow report developers to run queries against their Power BI data and return results. If you’re familiar with SQL, it’s very similar to running queries against a database, except it uses the DAX language and runs against data against a Power BI “semantic model”.
For example, the simply query below returns data for the table fact_NotebookDuration where the number of ExecutorCores is greater than 5.

Prior to the DAX Query View, developers had to rely on a third-party tool called DAX Studio to get this functionality. DAX Studio was (and still is) a fantastic tool for report developers, but many were unaware of it, and it required a separately downloaded application.
Now, with the advent of DAX Query View, the same functionality is available out-of-the-box in Power BI Desktop, helping consolidate all development tools into one interface.
Note that at the time of writing (May 2024), the DAX Query View is still in preview and may need to be enabled to become available. If you don’t see it, navigate to File > Options and Settings > Options > Preview Features and check the box next to DAX query view.
A peek under the hood
It’s helpful to understand a bit about how Power BI reports work before explaining how to use this tool.
To start, when a report developer uses “Get data” and chooses to import data into Power BI Desktop, data from the source is loaded in-memory into the Power BI Desktop file. The data is saved in a compressed state and becomes available for building reports. Alternatively, when a developer connects to a Power BI semantic model already published to Power BI Service, the data is made available through connecting to the previously compressed data stored in the cloud.
But how is that data accessed and rendered in the report? DAX queries. Let’s say you drag a table visual onto the report canvas and select the field SubmittedDate and the measure Duration Sum. That action would generate a DAX query under the hood that looks like the following, returning the data before rendering it on the table visual.

Now obviously that query is a bit more complicated than the first. And they can get much, much more complicated yet. But the basic concept is the same: Power BI relies on DAX queries to feed it data from the model.
So how should the DAX Query View be used?
DAX Query View use cases
Now that you understand the basics of DAX queries, let’s review the 3 most common use cases.
1. AD-HOC Data ANalysis
Have you ever started building a Power BI report and wanted better visibility into the data in your model? Or are you connected to a Power BI semantic model published to Power BI service and can’t see data in the table view? The DAX Query View can help where existing views are more limited.
Take, for example, a scenario where you need to see the number of rows in your table for each distinct value of Executor Size. You’re not going to want to count these one-by-one. And you don’t want to start creating measures and visuals just yet, you’re only exploring the data. A simple query like the following can answer that question for you.

The code above groups by ExecutorSize, and adds a column named “Count” to the query before sorting by the count descending.
The syntax for DAX queries is fairly simple to learn and has good intellisense to help suggest different formulas. A couple of good places to get started learning are the basic syntax page and DAX query view documentation from Microsoft.
2. Validation of DAX measures
Another use case for the DAX Query View is validating DAX measures. This can be particularly useful as its sometimes impossible to see the intermediate steps in your DAX measure without it.
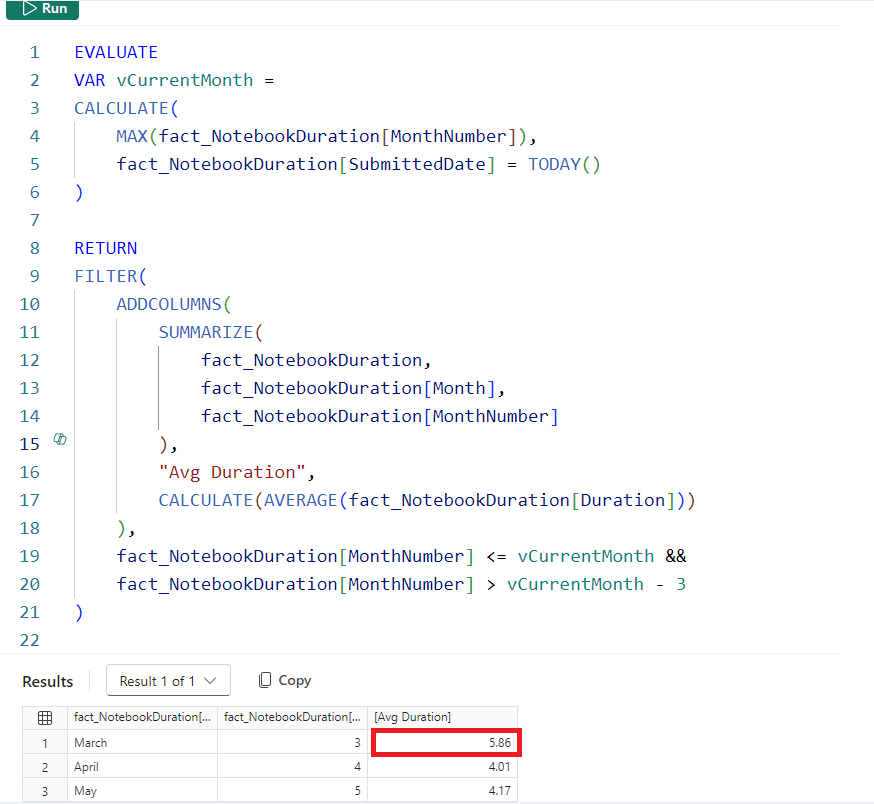
Let’s say you need to find the average duration by month over that last 3 months and then return the maximum average.
A DAX query can be used to see the average by month before calculating the maximum. Using a query that can later be converted into a DAX measure, you can see that the maximum average was 5.86 minutes and occurred in March. Now when you take the max of this function, you can validate that the number returned is accurate.
3. REport optimization
Ever had a visual that took 30 secs (or multiple minutes) to load? Waiting for this can be like watching paint dry. DAX Query View can be very useful for determining where the bottleneck in the visual lies in order to optimize it.
Recall that each visual in a report is sending data back to the model using DAX queries. By using the Performance analyzer (under the View tab) you can display the length of time taken to render each visual.
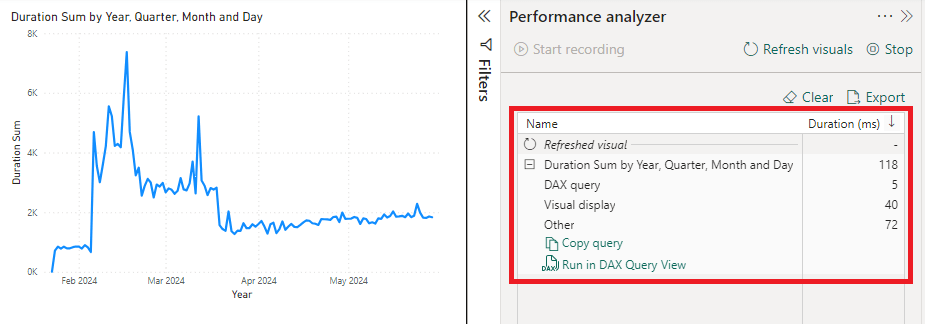
In this case, the DAX query only took 5 milliseconds to run. But in the case of a complicated DAX measure, this could be minutes. The option to “Run in DAX Query View” at the bottom will take the visual query and show you the actual code running behind the scenes. With some practice, this will enable you to start finding bottlenecks in the code and make adjustments to the visuals and measures to improve performance.
A niche (but very helpful) tool
The DAX Query View may not be used for every report and might feel slightly intimidating at first. But becoming proficient in this tool can greatly improve your ability to analyze data and develop optimized and accurate reports in Power BI.
Have I missed any use cases for the DAX Query View? What are some of the most beneficial features you’ve found using this tool?

Leave a comment